Sexual orientation census undercounts older people and those who shun labels
Census 2021 was the first to collect information on the sexual orientation of residents aged 16 years and over in England and Wales. Of those who completed the survey, 1.54% identified as gay or lesbian, and approximately 1.51% identified as bisexual or pansexual. A further 0.06% identified as asexual, and 0.03% as queer. This is almost certainly an underestimation of the actual national diversity of sexual orientation.
The item on sexuality was introduced for equity monitoring. The Office for National Statistics conducted extensive research, including the 2017 census test, to determine the exact wording and location of the item.
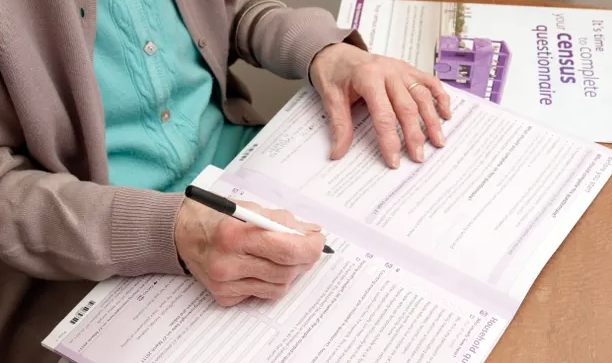
There were initial concerns that people would skip the voluntary question on sexual orientation, or that the inclusion of a question on sexual orientation would lead to people breaking off completing the census. But results reported in 2018 found the test response rate acceptable. In the 2021 census, 7.5% of respondents (3.6 million people) did not answer the question. This is not an irrelevant statistic, despite it receiving no further contextualisation in the initial release on Friday.
Non-responders are more likely to be LGBTQ+. It is reasonable to assume that those who are themselves part of the LGBTQ+ community are the most likely to show resistance to, and mistrust in, disclosing their sexuality to the government. Why would people disclose their sexuality to the government when it is the government that has previously weaponised this against them?
This is particularly true for older respondents, who are more likely to have a lived history of the criminalisation of homosexual behaviour and government-tolerated or created discriminatory policies. Some evidence for this can be found in the 2018 census test, where the level of non-response was significantly greater for those who completed it on paper (20.2%) than for those who completed it online (4.8%). Older people were far more likely to complete the test on paper. The 2021 census is probably undercounting the sexual diversity of older people.
There are also concerns about the barriers for younger people for completing the census as a whole, particularly those aged 16 to 25 and students who have more than one address. Disproportionately missing people in this age range is a problem because previous research has found that people these ages are by far the most likely to identify as LGBTQ+.
While “bisexual” was an official category, chosen by 1.28% of respondents, an additional 0.23% of people used the “other” category to write “pansexual”. In the reporting of these data, it is important that the pansexual figure doesn’t get lost.
Bisexuality is most often defined as the attraction to same and other genders. Pansexuality is often defined as attraction regardless of gender. Conceptually, these two labels are almost identical. It makes the most sense to report this as a total figure of (approximately) 1.51% who identify as “bisexual or pansexual”.
Even putting bi and pan together, the census gives lower rates than other recent sexuality research. For example, a report by the LGBTQ+ charity Stonewall published in 2022 found that, after heterosexual, the next most frequent sexual identify was bisexual – 5% of people identified as bisexual, and 1% as pansexual.
There is another major way the census 2021 sexual orientation statistics fail to capture the diversity of sexuality in England and Wales: by forcing individuals to choose categorical sexuality labels.
Research that uses versions of the Kinsey scale, allowing people to choose their sexuality on a scale between 0 (completely heterosexual) and 6 (completely homosexual), find much more nuanced results. For example, in a 2019 YouGov survey, one in four participants (24%) placed themselves between 1 and 5, indicating at least some attraction to more than one gender.
Many people who are not heterosexual, particularly those who are attracted to multiple genders, shy away from labels. This makes it difficult, even impossible, to see them represented in the numbers published today by the ONS.
Like many LGBTQ+ people, I felt a tremendous joy in completing the census and being able to have my bisexuality made visible. The introduction of this item is wonderful, but we need to be cautious that we don’t overstate who these figures represent.


